I am proud to announce that my book is now available for purchase! Please order Oracle RAC Performance Tuning today!
Writing this book was a great experience for me and I hope the readers get value out of it.
I am proud to announce that my book is now available for purchase! Please order Oracle RAC Performance Tuning today!
Writing this book was a great experience for me and I hope the readers get value out of it.
I have a deadlock being reported in my 3-node Oracle RAC database (version 11.2.0.4) as can be seen in the Alert Log. Being that this is an Oracle RAC database, resources are managed globally and the Lock Manager Daemon (LMD) gets involved. The message in the alert log pointed me to a LMD trace file which contained this Global Wait-For-Graph (GWFG).
*** 2015-02-27 04:16:33.183
Submitting asynchronized dump request [1c]. summary=[ges process stack dump (kjdglblkrdm1)].
Global blockers dump end:-----------------------------------
Global Wait-For-Graph(WFG) at ddTS[0.394d] :
BLOCKED 0x551b2c698 2 wq 2 cvtops x1 TM 0x11ffa3.0x0(ext 0x0,0x0)[6B000-0004-0000022D] inst 4
BLOCKER 0x5513ed318 2 wq 2 cvtops x1 TM 0x11ffa3.0x0(ext 0x0,0x0)[B6000-0006-00000099] inst 6
BLOCKED 0x5513ed318 4 wq 2 cvtops x1 TM 0x11ffa3.0x0(ext 0x0,0x0)[B6000-0006-00000099] inst 6
BLOCKER 0x5513ef5b8 4 wq 2 cvtops x1 TM 0x11ffa3.0x0(ext 0x0,0x0)[66000-0005-00000FDB] inst 5
BLOCKED 0x5513ef5b8 4 wq 2 cvtops x1 TM 0x11ffa3.0x0(ext 0x0,0x0)[66000-0005-00000FDB] inst 5
BLOCKER 0x551b2c698 4 wq 2 cvtops x1 TM 0x11ffa3.0x0(ext 0x0,0x0)[6B000-0004-0000022D] inst 4
* Cancel deadlock victim lockp 0x551b2c698
Note: The actual SQL and a few other details may have been changed to protect the innocent.
So there I have 3 sessions involved in the deadlock. One each on instance id 4, 5, and 6.
I was looking at the trace file generated on instance id 4. Above the GWFG was this information:
user session for deadlock lock 0x551b2c698
 sid: 1727 ser: 539 audsid: 996549224 user: 13944/MP_SYS
 flags: (0x41) USR/- flags_idl: (0x1) BSY/-/-/-/-/-
 flags2: (0x40009) -/-/INC
 pid: 107 O/S info: user: oracle, term: UNKNOWN, ospid: 11229
 image: oracle@myhost04.naucom.com
 client details:
 O/S info: user: web-svc, term: web-server1, ospid: 4276:864
 machine: DOMAIN\web-server1 program: iis.exe
 client info: user: WEBSERVICE
 current SQL:
 INSERT INTO MP_SYS.T2( column_list) SELECT column_list FROM MP_SYS.T1 WHERE MP_SYS.T1.P_ID=:B1
DUMP LOCAL BLOCKER: initiate state dump for DEADLOCK
 possible owner[107.11229] on resource TM-0011FFA3-00000000
So I can see information about the machine, program, and SQL statement being executed. The user session identifier in red above corresponds to the id value in the GWFG. Lets look at the first two lines of the GFWG again.
BLOCKED 0x551b2c698 2 wq 2 cvtops x1 TM 0x11ffa3.0x0(ext 0x0,0x0)[6B000-0004-0000022D] inst 4
BLOCKER 0x5513ed318 2 wq 2 cvtops x1 TM 0x11ffa3.0x0(ext 0x0,0x0)[B6000-0006-00000099] inst 6
So the SQL statement and session details match this first line. This session is blocked on inst 4. The blocker is on inst6 and is identified as 0x5513ed318. Well who is this? There are no other details in this GWFG to help us with the BLOCKER.
To learn more about the blocker, I went to inst 6 and did this:
cd /u01/app/oracle/diag/rdbms/admin/orcl/orcl6/trace
grep 0x5513ed318 *
So I just did a grep on the session identifying value and was given a LMD trace file. Looking in that LMD trace file on the other instance gives me details about the blocking session.
user session for deadlock lock 0x5513ed318
 sid: 1206 ser: 2673 audsid: 996459926 user: 13944/MP_SYS
 flags: (0x41) USR/- flags_idl: (0x1) BSY/-/-/-/-/-
 flags2: (0x40009) -/-/INC
 pid: 182 O/S info: user: oracle, term: UNKNOWN, ospid: 7049
 image: oracle@myhost06.naucom.com
 client details:
 O/S info: user: web-svc, term: web-server2, ospid: 4276:864
 machine: DOMAIN\web-server2 program: iis.exe
 client info: user: WEBSERVICE
 current SQL:
 DELETE FROM MP_SYS.T1 WHERE P_ID = :B1
DUMP LOCAL BLOCKER: initiate state dump for DEADLOCK
 possible owner[182.7049] on resource TM-0011FFA3-00000000
I can see that the blocked session was issuing a INSERT statement on a table and the blocker was issuing a DELETE on the same table.
There is another session involved but at this point, it is elementary to get session details using the same steps above.
Hopefully, this blog entry has shown how to use the GWFG to diagnose the SQL statements and the object involved in the global deadlock. I know know the exact SQL statements involved in the deadlock, and by extension, the objects involved as well. The resolution to the problem is no different than deadlock resolution in single-instance databases.
For more information about Oracle RAC Global Enqueue Services (GES), read Chapter 2 of my Oracle RAC Performance Tuning book.
It is now possible to use Oracle 12c as a repository database for Enterprise Manager 12c Cloud Control. Oracle 12c is almost 2 years old and the first patch set is almost 1 year old. So its about time in my opinion.
If you are planning on using DB12c for your EM12c repository, then make sure you read Note 1987905.1 for important information on the patches you’ll need to apply.
We recently had one of our SQL Server instances experience a very large volume of change. Not suprisingly, the transaction log grew really big and was very close to filling up the disk. I had our SysAdmins add more space to the transaction log disk. The process that generated the large volume of transactions is a one-off process and I wanted to shrink the transaction log and let the SysAdmin take his space back to the storage pool. So I did as any SQL Server DBA might do. I took a backup of the transaction log. After that, I attempted the shrink operation.
Note: I normally don’t shrink the transaction logs. I only do this when I now a non-regular process grew it too big and I want to get back to something more normal.
When I attempted the shrink operation on the transaction log file, I received this error:
Msg 8985, Level 16, State 1, Line 1
Could not locate file 'xxx_Log' for database 'master' in sys.database_files.
The file either does not exist, or was dropped.
Hmm…the only thing I did was to backup the transaction log. So this is odd. I check the file system and sure enough, the file was there. So why doesn’t SQL Server see it? I discovered my answer when I queried sys.master_files. This view had no knowledge of any transaction log for that database. The database is in FULL recovery mode so my first check was to make sure that transactions could occur in the database. They could so my end users don’t notice the issue. The application appears to be fine. So how do I get the logfile back?
The first thing I did was take an backup of the instance. That way, if my method to fix screws it all up, I can at least go back to this known state. I then detached the problematic database. I then use the sp_attach_single_file_db procedure to re-attach the database as follows:
USE [master]
GO
EXEC sp_attach_single_file_db @dbname='xxx',
@physname=N'P:\Program Files\Microsoft SQL Server\MSSQL10_50.MSSQLSERVER\MSSQL\DATA\xxx.mdf'
GO
File activation failure. The physical file name "V:\Program Files\Microsoft SQL Server\MSSQL10_50.MSSQLSERVER\MSSQL\DATA\Tfs_NAUCollection_Log.ldf" may be incorrect.
New log file 'V:\Program Files\Microsoft SQL Server\MSSQL10_50.MSSQLSERVER\MSSQL\DATA\xxx_log.ldf' was created.
SQL Server knew that the transaction log was missing so it created it for me. I was back in business! The last thing was to take another backup that contained my working, well-functioning database.
This really isn’t a new topic. I’m not first one to publish something like this. But I had a need to get these instructions posted on my blog. So here is how I created a two-node Oracle RAC testbed on my laptop. An earlier blog post shows why I think testbeds are important. When I wrote Oracle RAC Performance Tuning, I used such a testbed for much of the material I put in the book. At one point, I had a 3-node RAC cluster on my laptop by adding another VM and adding it to the cluster.
My instructions show how I got Oracle RAC 12.1.0.2 on my MacBook Pro with Virtual Box. If you use another VM hypervisor, then you can most likely get instructions with a simple Google search.
The instructions were too big for a blog entry, so I put it in a Word document (9.63MB).
SQL Developer 4.1 was released on Monday. Here is the link to download the latest/greatest version.
ThatJeffSmith has a nice recap of the new features on his blog. I like the new formatting options and the Multi-Cursor Support is awesome! The Instance Viewer is cool, but I typically have a session on in EM12c which meets most of my needs.
I’m working on getting my companies databases upgraded to Oracle 12.1.0.2 before our 11.2.0.4 databases lose free Extended Support in Jan 2016. One of the “gotchas” for us is that the SEC_CASE_SENSITIVE_LOGON parameter is deprecated in 12c. It’s still there, but who knows for how long.
Before I arrived at this company, they upgraded to Oracle 11.1 when this parameter was introduced. The DBA at the time used the parameter to kick the proverbial can down the road and avoid having to deal with changing the application to use case-sensitive logons. So now its time for me to make sure it gets handled before the parameter is extinct.
I am starting to write articles for publishing on SearchOracle.com. I have been loosely affiliated with them since 2001, mostly in their Ask The Experts section. My first article is on the benefits that tools can play in making your tuning life much easier. This article is posted here: http://searchoracle.techtarget.com/tip/Proper-tools-make-fast-work-of-SQL-performance-tuning
I’m excited to publish more articles. While I get about 40,000 hits per month on this blog, SearchOracle.com gets so much more.
In my last article for SearchOracle (referenced in my last post to this blog) I showed an example of how I quickly got to the root cause of a poor performing query using SQL Monitoring in Enterprise Manager. Today, That Jeff Smith of SQL Developer fame showed me a blog entry he wrote last October on using SQL Monitoring in SQL Developer. Pretty cool stuff! I can’t explain it any better than he can so please click on the last link there to see a video of it in action.
Most of my Oracle databases run on Linux. And prior to that, one form of Unix or another. I’ve grown quite accustomed to using scp to quickly transfer a file between systems.
While my databases may live in a *nix world, my workstation is normally a Windows OS. Natively, Windows has ftp, but not scp for file transfers. Most Oracle DBA’s using Windows for their workstation rely on Putty for an ssh client. Putty is simple, lightweight, and it just does the job. Putty can be downloaded here. The download is an .exe file and there is no installation. Just double-click the executable and you’re off and running.
I don’t know why, but when I first installed Putty, I put the executable in my C:\oracle directory. I didn’t want it on my desktop because “putty.exe” looks silly to me. I’d rather see a shortcut with the name “Putty” and that’s it. So my first experience with Putty was just that. Save the file in a directory and create a shortcut.
Later on, I wanted the scp utility on Windows. Thankfully, the same wonderful people who gave us Putty also gave us PSCP, which I call the Putty SCP client. The pscp.exe utility is downloaded from the same page as Putty.
None of this is new and not blog-worthy. But here’s the little trick I do. I saved pscp.exe in C:\oracle as well (feel free to use a different directory). I then renamed the executable to be just “scp.exe”. I also put C:\oracle in my PATH environment variable. Now, whenever I am in a CMD window, it looks like I’m using my regular *nix scp utility when I’m not.
C:\Users\bpeasland\Desktop>scp sqlt.zip oracle@host01:.
oracle@host01's password:
sqlt.zip | 908 kB | 908.7 kB/s | ETA: 00:00:00 | 100%
I can easily go back and forth from my Windows environment to Linux environments and use what appears to be the same program. I don’t have to remember that one system has one utility and another has a differently named utility.
I ran into a question on the forums today asking how to obtain certification information. Oracle includes this if you have a paid support contract. This blog post will show how to see certification information for an Oracle product on http://support.oracle.com for those that have access.
After you sign on to My Oracle Support, click on the Certifications tab.

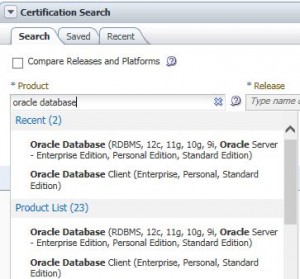
This will take you to the Certification Search box. After the last big upgrades to My Oracle Support, this functionality has become much easier. Simply type in the product you are interested in. In my case, I typed “oracle database”. Notice the popup menu below shows me my most recent searches that match this criteria as well as a full product list. I click on one of the options to complete my entering of the product of interest.
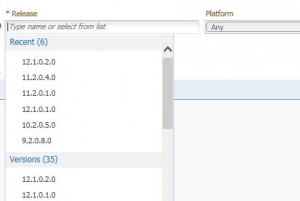
Next, I need to enter in a product version in the Release box. Just like before, a popup menu shows me my most recent searches and well as a complete list of versions.
Once the version is entered, press the Search button. and you will have your search results. I can now see all operating systems that are certified for that specific product and version.
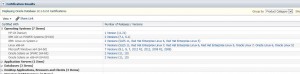
If this isn’t the information I am looking for, I can press the Edit Search link at the top right and change my search criteria.

I’m trying to upgrade a system’s Grid Infrastucture to the latest/greatest version. The OUI says that I need 7GB of free space and I’m a little short. This is on virtual machines so we can grow the disk easily enough. Everything is installed in the root partition (this isn’t production) and my SysAdmin is asking me if he needs to grow /dev/sda1 or /dev/sda2. Well the disk device is /dev/sda which is the first disk device on the system. This disk device has two partitions, named sda1 and sda2. Which partition is for the root file system? Today, I stumbled across the lsblk command which shows me exactly how this disk is partitioned. The lsblk command is short for List Block Devices. Here is the output on my system.
lsblk
NAME MAJ:MIN RM SIZE RO TYPE MOUNTPOINT
sda    8:0    0   42G 0 disk
├─sda1 8:1    0  400M 0 part /boot
└─sda2 8:2    0 31.6G 0 part /
sr0   11:0    1 1024M 0 rom
The output above clearly shows that sda1 is for the boot partition and sda2 is for the root partition.
Here is another article I wrote for SearchOracle.com in case you missed it. This one focuses on how to use ADDM to quickly diagnose a performance problem.
http://searchoracle.techtarget.com/tip/Oracle-ADDM-helps-resolve-SQL-performance-problems
I got a call from someone that they were getting TNS-12519 errors in their application. Sure enough, those messages were in the listener.log file as well.
TNS-12519: TNS:no appropriate service handler found
For those that aren’t familiar with this error, it typically means one of two things. Either the service name is not registered with the listener or that the database has reached its maximum number of processes. For the latter, what happens is that the Listener knows that the database can’t accept any new processes so it takes the service name out-of-service so to speak. A quick “lsnrctl status” shows me that the service name is registered correctly. So it must be the latter. I then issue the following query and confirm my suspicions.
SQL> select resource_name,current_utilization,max_utilization
 2 from v$resource_limit where resource_name='processes';
RESOURCE_NAME   CURRENT_UTILIZATION MAX_UTILIZATION
--------------- ------------------- ---------------
processes                       299             300
Sure enough. I’ve reached max processes, which is defined in my SPFILE to be 300. I increased the parameter to 600 and bounced the instance. We hit the error again with double the number of processes. I obviously need to dig into this further.
For some background, and for something that will be important later on, it is important to know that this database supports our automated testing efforts. We have a test harness that exercises our primary production application. This test suite launches the application, connects to the database, pushes a few buttons and selects a few menu items and then disconnects.
I examined the listener.log file to see where the connection requests were coming from. These requests were coming from a rogue application server, not our test suite. I knew something was amiss because we had not yet started the test suite and we were getting the errors. We fixed the application server and I didn’t see the errors return. We then fired up the test suite and some time later, the TNS-12519 errors returned. Hmmm…I thought I found the culprit. But let’s check our process utilization.
SQL> select resource_name,current_utilization,max_utilization
 2 from v$resource_limit where resource_name='processes';
RESOURCE_NAME   CURRENT_UTILIZATION MAX_UTILIZATION
--------------- ------------------- ---------------
processes                       89             157
So I’m currently seeing 89 processes with a maximum utilization of 157. I’m nowhere near my new limit of 600. So what gives? It took me awhile to figure out what the issue was. The service name is correctly registered and I’m nowhere near my limit. MOS NOTE 552765.1 talks about how the Listener arrives at the TNS-12519 error. Previously, I was seeing the most common cause. Max PROCESSES had been reached. But not this time So what gives?
After investigation, I found my answer in the listener’s log. But it wasn’t obvious like some big error message. The first occurrence of the TNS-12519 error was at 9:38 am. I grep’ed for “service_update” in the listener log and saw these entries.
25-JUN-2015 09:17:08 * service_update * orcl * 0
25-JUN-2015 09:17:26 * service_update * orcl * 0
25-JUN-2015 09:17:29 * service_update * orcl * 0
25-JUN-2015 09:17:44 * service_update * orcl * 0
25-JUN-2015 09:17:50 * service_update * orcl * 0
25-JUN-2015 09:17:53 * service_update * orcl * 0
25-JUN-2015 09:18:56 * service_update * orcl * 0
25-JUN-2015 09:18:59 * service_update * orcl * 0
25-JUN-2015 09:19:50 * service_update * orcl * 0
25-JUN-2015 09:20:11 * service_update * orcl * 0
25-JUN-2015 09:21:27 * service_update * orcl * 0
25-JUN-2015 09:22:09 * service_update * orcl * 0
25-JUN-2015 09:24:05 * service_update * orcl * 0
25-JUN-2015 09:27:53 * service_update * orcl * 0
25-JUN-2015 09:29:32 * service_update * orcl * 0
25-JUN-2015 09:34:07 * service_update * orcl * 0
25-JUN-2015 09:41:45 * service_update * orcl * 0
Notice that this service update occurs regularly at 9:17 and 9:18, but the time between the service updates takes longer and longer. Notice that there was 8 minutes 38 seconds between service updates at the end (9:34 to 9:41). Why is this important?
This is an Oracle 11.2.0.4 database. For 11.2 and earlier, PMON is responsible for cleaning up after processes and for passing information to the Listener. On database startup, PMON tries to register the services with the Listener. One other thing PMON does is to tell the Listener how many max processes can be serviced. In this case, PMON tells the listener that it can have up to 600 processes. PMON does more, but for purposes of this discussion, that’s enough.
One important piece to know is that the Listener never knows how many processes are currently connected. It only knows how many connection requests it has helped broker. The Listener never knows if processes disconnect from the database. The service_update above is where PMON is telling the Listener how many processes are actually being used. So at 9:34:07, the PMON service update tells the Listener that there are 145 processes in use. The Listener is now up-to-date. When a new connection request comes in, the Listener increments this to 146 processes. Between the service updates, the Listener is totally unaware that 1 or more processes may have been terminated, normally or abnormally. It keeps incrementing its count of processes until the next service update when the Listener gets an accurate account of how many processes are spawned.
So we have that 8.5 minute gap between service updates. Why did it take PMON so long to get back to the Listener? Well the clue for that is in the listener.log as well. I stripped out everything from the log prior to the 9:34 service_update and after the 9:41 service update. From there, it was easy to grep for “(CONNECT_DATA=” in what remained and pipe to “wc -l” to get a count of lines.
During this 8.5 minute interval, I had well over 450 new connection requests! Yet most of those new connections terminated as evidenced by V$RESOURCE_LIMIT showing me that I had a max of 150. PMON was so busy cleaning up for the application exiting its database connections that it had a big lag before it updated the Listener. As far as the Listener was concerned, the 150 current connections plus the 450 new connections meant that it reached its limit of 600.
PMON can take up to 10 minutes to get back to the Listener with its next service update. Cleaning up after sessions exit the instance has a higher priority than service updates to the Listener. At the 10 minute mark, PMON makes the service update the top priority if the service update had not been previously done in that time interval.
Remember that this is a database to support automated testing. We have to live with this many connect/disconnect operations because we have an automated robot testing out our application in rapid-fire fashion. We don’t want to change how the application works because it works very well when run by a single user. Our automated test suite is executing the application differently than what it was designed to do. But we want to exercise the application as its written to potentially expose bugs before the code changes hit production.
For now, I’ve increased the PROCESSES parameter to a value that we’ll never reach. All this so that the Listener can not hit the limit in its internal counter. The more PROCESSES, the more memory needed in the SGA to support that higher number. But this database can handle it.
If anyone knows of a way to get the service update to occur in a 5 minute window, please let me know. There aren’t any documented parameters to control this behavior and I’ve been unable to find an undocumented one as well.
Lastly, this issue is in one of my 11.2.0.4 database. Oracle 12c changes the architecture a bit. The new Listener Registration (LREG) background process handles the work that PMON used to do. I don’t have a system quite yet to test, but I bet that LREG won’t have the same issue in 12c that PMON is exhibiting here in 11g as LREG won’t have to handle cleanup duties that PMON does. MOS Note 1592184.1 shows that LREG will do the service updates.
Most of the time, I post entries in this blog to share knowledge with others. Sometimes, I post an entry so that in the future, I can quickly find an answer to something I know I forgot. This is one of those times. If other’s find this useful, great!
I’ve been working on a Linux system that has had some memory-related issues for one of my Oracle databases. I ended up needing to increase the swap space as it was set too low. After swap was increased, I saw some swap space being used and I wanted to know if this was Oracle using swap or something else. So who is using my swap space on this Linux system? I can run the following command to find out.
for file in /proc/*/status ; do awk '/VmSwap|Name/{printf $2 " " $3}END{print ""}' $file; done | sort -k 2 -n
The output is sorted in ascending order with the most egregious offenders at the bottom of the list.
To sort in reverse order and then stop the output from scrolling off the screen, use this version instead.
for file in /proc/*/status ; do awk '/VmSwap|Name/{printf $2 " " $3}END{ print ""}' $file; done | sort -k 2 -n -r | less
My web site was down for the last 4 days. My apologies. I had to spend a lot of time going back and forth between my ISP and my domain registrar. But it seems to be sorted out now.
So the good news, depending on your perspective, is that once my site came back up, I felt the need to spend time with it. I decided to do something that I’ve been meaning to get accomplished for quite some time. I added a widget to the right which shows my last 5 tweets. That widget probably only gets a smile out of me and not anyone who reads the blog. 
As you may know from a previous post on this blog, or if you follow me on Twitter (BPeaslandDBA), I like Lighty for Oracle, a product by Orachrome. I love this product and how easy it is to obtain performance diagnostic information. I’m very familiar with Oracle’s Enterprise Manager and I use EM12c all the time when I get calls about poor database performance. But I am now hoping that Lighty becomes another tool in my arsenal.
I don’t expect that Lighty will replace Enterprise Manager. EM12c does so much more than Lighty can, i.e. monitoring and alerting, and various database administration tasks. So I’ll be keeping EM12c thank you very much. But I will be relying on Lightly more for the one part of my job that Lighty does really well, provide information to aid in performance tuning efforts. Lighty is only for performance tuning and because it has a singular focus, it does the job very well.
I’ll try to show some highlights of why I think Lighty is a great tool to use. I’ll contrast with EM12c. For starters, in EM12c, I go to Performance –> Performance Home and I see a screen similar to the following.
Right away I can see that I have CPU resource contention. The main screen in Lighty looks like the following.
So we have very similar information. And that’s where the differences end for me…right at the start. In EM12c, I am forced to make a decision, do I drill down into the CPU utilization, or one of the wait classes like User I/O? Since the above shows CPU contention, in EM12c, I click on the CPU portion of the chart to drill down. At this point in EM12c, I am only considering CPU usage for my analysis. As we’ll see later, Lighty doesn’t require me to make that choice if I don’t want to. Below is my chart from EM12c.
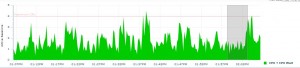
The chart above is very common for me in my Oracle RAC database. The chart above is showing the CPU utilization for three instances of my clustered database. Which one is dominating the CPU utilization? Well they all look fairly equal. Yet EM12c forces me to choose one instance for analysis. I can’t examine all 3 instances in one screen. A lot of my work is with Oracle RAC performance tuning and EM12c’s limitations bother me here. I have to choose a wait class or CPU and then choose an instance before I can obtain information on the top SQL statements or top sessions. If I drill down far enough in EM12c, I can get a screen like the following.
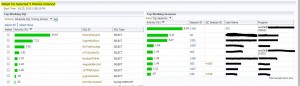
I’ve finally gotten somewhere at long last! I can see the top SQL statements and the top sessions. Notice the highlighted part. This is detail for a 5 minute window. The five minute window is represented by the shaded box in the CPU utilization chart below for the instance.
In EM12c, I can drag the shaded box to a different time and the top SQL and top sessions information will change to match. But I can’t change this to a 10-minute interval or some other time period. I’m stuck at 5 minutes.
Now let’s contrast this to Lighty. We’ve already seen the performance chart just like EM12 has. Below that performance chart in Lighty is a detail pane on the top SQL statements. I didn’t have to click on anything to get the top SQL statements.
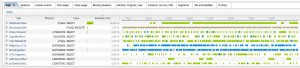
Right away, I see one difference between Lighty and EM12c. My top SQL statements are not solely restricted to CPU or a specific wait classIf I do want to restrict the information, I can choose from a menu box above the performance graph.
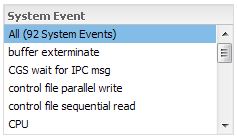
I typically have All selected, but I can choose to see just CPU if I choose. Lighty doesn’t limit me like EM12c does, unless I make the choice to subset the information.
Notice in the top SQL that I am presented a timeline of the events for that SQL. For example, we can see the top SQL statement in the list is using lots of CPU. Other SQL statements in the list start and stop their CPU usage, shown in light green. User I/O is simultaneously shown here in blue. If I expand a SQL statement, I can get a breakdown of that SQL statement.
Just by click on the Plus sign next to the SQL statement, I can see that this statement has two different execution plans and one of them is consuming 93.92% of the total CPU utilization. If I expand that plan, I can see where it is spending its time, broken down by wait event.
So let’s recap this. I started Lighty and was immediately presented with my top SQL statements and in a single click, I know that the top one has a CPU-consuming execution plan. That’s super quick and easy in my opinion. EM12c makes it harder to get to this information and EM12c will not show me when a SQL statement started consuming CPU and when it stopped like the graphs Lighty provides.
If I click on a SQL statement, much like I would in EM12c, Lighty will show me stats on the specific SQL. If I click on the Usage tab, I can see all of the sessions that ran this statement. Notice that the chart shows a timeline of when that session was consuming that resource for this SQL statement. EM12c won’t show me that level of detail.
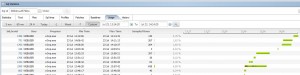
With the above, I can easily see that it is multiple sessions executing the same statement at different times.
Remember that EM12c made me choose an instance for this Oracle RAC database? In Lighty, I don’t have to make that choice. But I can quite easily. Lighty is RAC-aware and detected the multiple instances. By default, I have all of the instances chosen. A simple pulldown menu lets me select one of them and the information on the screen automatically adjusts to just that instance.

Remember in EM12c where that shaded window represented a 5-minute period of time. In Lighty, the SQL and session details are for the entire graph. If you want a 5 minute window, you can choose the 5 minute option above the graph. By default, it has a 60 minute window chosen.

And I can choose other options as well, including a Custom date/time range. In EM12c, the graph is for 1 hour and I can’t change it.
EM12c has its ASH Analytics for letting me look at performance in the past. But I’ve always had problems with it. With ASH Analytics (which lets me view the Active Session History), I can change that gray window to be something other than 5 minutes. But for me, EM12c simply never returns the data. Maybe I have something wrong with my EM12c environment. But Lightly works out of the box with historical ASH data. Let’s say I got a call about a performance issue that occurred between 8:00 and 9:00 this morning. I simply choose a Custom time range.

In EM12c, I’m forced to go to a different web page, Performance –> ASH Analytics.
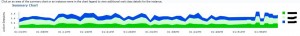
So far, you’ve probably latched onto the idea that I think that Lighty is a quick and easy way to obtain much of the same information I can get from EM12c. And you’d be right! Here is another area that I like about Lighty. If I go to Window –>Multiple Database Monitoring then I can see graphs of many different performance metrics for multiple databases. Here is an example.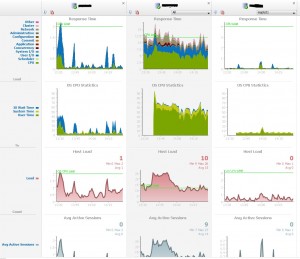 At a glance, I can monitor multiple databases on one screen. EM12c won’t let me do that. I can see that the database on the far right is pretty idle while the database in the middle is getting hit pretty hard. Scrolling down the page, I get charts for many metrics:
In EM12c, I would have to visit too many pages to obtain the same information that Lighty gives me in one page.
All of my examples are relying on the same Diagnostics and Tuning Packs that I have licensed. If you do not license those, Lighty provides similar functionality with Statspack and their version of L-ASH (Lighty ASH).
All in all, I think Lighty is a great tool for the DBA who is responsible for performance tuning. The cost is very reasonable as well. The more I use the tool, the more I come to appreciate how quickly I can get information. I can turn things on or off with no more than two clicks to be able to easily drill down to the root cause of my performance issues.I encourage all Oracle DBA’s to download the trial and see if this product is right for them. Lighty can be found here: http://www.orachrome.com/en/index.html
This morning, I was reading this article about employees lack of understanding how critical it is to protect business data. The article got me to think about a few different points.
As a DBA, I’ve always tried to be my company’s Data Guardian. To me, the data inside the databases I manage is a valuable corporate asset. After all, the database exists for one reason, to provide efficient and timely access to the data. That data has value otherwise the company wouldn’t pay all the money it does to store it, to manage it, to make it available to end users. So in that vain, I’ve always strived to be the one that says we can’t just let people have unfettered access to the data. We must have proper security controls in place in our database. We must be vigilant in our security mechanism by making sure the database is patched regularly, is on current database versions, that we implement the concept of “least privilege”, etc.
Because being a DBA is my business and I’ve always been the Data Guardian, I’ve been involved in numerous conversations with people inside my company about protecting that valuable corporate asset, the data. Admittedly, most of these conversations are with people already in the company’s IT department. It is rare for me to have these types of conversations with people outside of IT. Yet as this article points out, 43% of respondants to a poll “admitted that they were either somewhat or completely ignorant about the value of corporate data.” I probably need to get out of the IT department once in awhile and have these same conversations with non-IT people.
Then the article discussed something that I hadn’t really considered before, at least not consciously, even is my role as the company’s data guardian. The article talks about how employees “were more worried about losing their personal data, than leaking out business data which could be far more damaging.”
Like many people in the 21st century, I too have been victim of my private, personal data being breached, data that was held by some other party. I was one of the individuals that was victim to the Target data breach in 2013. My bank quickly issued a new card since my card swiped at Target was at risk. Target even offered the victims some form of identity protection. More recently, I know that my private data has been breached in the US OPM systems hack. Me and 4.2 million other individuals. Since this data breach is more recent and does apply to me directly, I’ve been giving thought about data breaches in general and how they affect me.
But as this article points out, have you given thought to how much a data breach at our company could affect you personally? I certainly give thought to how much a data breach affects myself and my family when Target and OPM were hacked. But how does a data breach affect me and my family if the databases I’m in charge of at my job get hacked? The databases in my control contain very little of my Personally Identifiable Information (PII). But they do contain PII of our customers and clients, which I am very well aware of. If their PII gets out, how does it affect me?
Well certainly, if I am found at fault, my company could fire me. I could lose my job. I think that’s the most obvious affect of the data breach. But what else? I know of a data breach at a company that I used to work for in the past. That breach occurred well over a decade after I left that company so it had nothing to do with me. But I do personally know some of the individuals who were fired over the incident, people that I did work with and built relationships with. The company was sued over the data breach. And some of my ex-coworkers were named in the lawsuit. Even if it is ultimately decided that these individuals are not at fault, they still have the nightmare of needing to defend themselves and their reputation. What other ways are there for me to be personally affected by my company’s data breaches?
Like many employees, I feel that I have a vested interest in how well the company performs. Many companies try to instill this mindset into their employees by offering stock options and bonuses tied to company performance. Can one metric of company performance can be the number of data breaches exposing valuable corporate data to hackers? If nothing else, our customers may lose confidence in our ability to keep their PII safe. Lost confidence means that our customers may quickly become some other company’s new customers.
So even if I’m only thinking about my personal, self-serving viewpoint, it is incumbent upon me to be more vigilant as the corporate Data Guardian. The more the company succeeds, the better it will be for me personally in the long run. After reading this article, I’m not sure that others in the company have the same values. Maybe I need to do more to spread the word. Most likely, I need to do more as the Data Guardian than sit in my office only talking to other IT staff about data security.
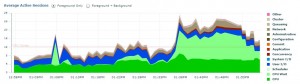
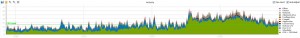
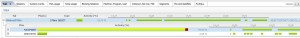
I was using Lighty to examine performance of a new Oracle RAC database that went into service today. You can see something similar in Oracle Enterprise Manager 12c Cloud Control if you choose. Anyway, here is the performance graph of the RAC database in question.
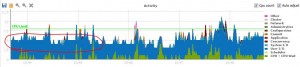
It is common wisdom that if the chart is below the green line representing the CPU Limit, that we don’t have major contention. But this is an Oracle RAC database. The chart above is for all instances (this is a 2-node RAC db) as I selected both instances in Lighty.

But if I switch to one instance, I see a different story.
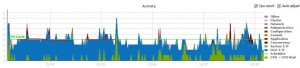
Notice that during the same time period, I have user I/O saturation.
The moral of the story is that when looking at Oracle RAC databases with performance tuning tools, you sometimes have to look at and individual instance. In my example, looking at the overall database (all instances), things looked fine but when I zoomed into a specific instance, the same performance tool painted a different picture.